
 Primary characteristics - general basis
for solid-filled symbols in the vulnerability maps. Secondary characteristics - general
basis for some cross-hatched symbols in the vulnerability maps.
Primary characteristics - general basis
for solid-filled symbols in the vulnerability maps. Secondary characteristics - general
basis for some cross-hatched symbols in the vulnerability maps.
An assessment of ground water vulnerability allows States to account for the variability in landscapes, pesticide usage, agronomic patterns, and farming practices across the state. Some references define vulnerability as relating only to the intrinsic characteristics of the ground water system (geologic and hydrologic), while others define 'sensitivity' as that which considers man's influence (pesticide use and properties, management practices, etc). Still others switch the meaning of these two definitions. For the purpose of this report, vulnerability can be defined as the "likelihood or potential for contaminants to reach a specified position in the ground water system after it has been introduced at some location above the uppermost aquifer".3
In order to develop and implement a PMP effectively, states must have basic information on the occurrence, movement, and quality of ground water in relation to the occurrence, movement, and quantity of pesticides in any particular area.4 In addition to the natural and cultural variability of the factors used to make an assessment, assessments also vary in the complexity in which these factors are used. There are three categories of methods for assessing ground water vulnerability:3
This report falls into the first category, although no ranking of the variables is done. Because development and implementation of PMPs will require the knowledge and expertise of individuals at the local level, any assessment of ground water vulnerability on a statewide scale will need to be general in scope.9 However, an assessment of this type should lead to more area-specific studies which will help guide the PMP process, including monitoring inventories and assessments, the evaluation and development of agricultural best management practices (BMPs) for pesticides, programs to disseminate information to pesticide applicators, and determine if more regulations are needed.
Any method will have some level of uncertainty based on the variability in how the data were collected and processed, and the variability in time and space of the data characteristics. Because of this uncertainty, three principles, offered as 'laws of ground water vulnerability assessments' by the National Research Council,3 are worth mentioning:
1. All ground water is vulnerable;
2. Uncertainty is inherent in all vulnerability assessments; and
3. The obvious may be obscured and the subtle indistinguishable.
These underscore the need to understand the information used in developing an assessment, be cautious in developing policy from this information, and reevaluate the data following policy implementation.
The type of soil present at a site plays an important role in ground water vulnerability because soils vary in their ability to adsorb, or hold, pesticides. This is due, in large part, to the amount of organic matter present, and the porosity of the soil. In general, sandier soils are more porous and have less organic matter than clayey or loamy soils. Depth to ground water is important because, in general, a deeper water table allows for a longer time of transport, giving the pesticide more chance to be broken down through chemical or biological action. While other ground water and geologic factors may also be important in assessing ground water vulnerability, it is felt that the soil surface characteristics and depth to ground water variables factor heavily in pesticide contamination. In addition, several ground water and aquifer variables used in other studies have been determined to be somewhat factored into these two characteristics .12, 13 Vulnerability in this map has been divided into three main categories: high, moderate, and slight (see Table 1). The soils classification consists of two components: soils having a clayey, silty, or loamy texture, and those having a sandy, loamy sand, or sandy loam texture. The ground water component is divided into two components, as well: greater than 30 feet to the water table, and less than 30 feet to the water table.
Table 1. Vulnerability classification and soils/depth to ground water characteristics.
| Site Characteristics / Relative Vulnerability | Water Table > 30 ft. | Water Table < 30 ft. | Less Porous Soils | More Porous Soils |
| Slight (green) - Clayey, silty or loamy soils with a water table greater than 30 feet below the ground surface | |
|
||
| Slight (green/orange; moderate in sandy areas) - Generally clayey, silty or loamy soils with a water table greater than 30 feet below the ground surface. | |
|
|
|
| Slight (green/yellow; moderate in areas with water table near the surface) - Generally clayey, silty or loamy soils with a water table generally greater than 30 feet below the ground surface. | |
|
|
|
| Moderate (orange/green; slight in areas with clayey, silty or loamy soils) - Sand, loamy sand or sandy loam soils with little organic matter and a water table generally greater than 30 feet below the ground surface. | |
|
|
|
| Moderate (orange) - Sand, loamy sand or sandy loam soils with little organic matter and a water table greater than 30 feet below the ground surface. | |
|
||
| Moderate (yellow) - Clayey, silty or loamy soils with a water table less than 30 feet below the surface. | |
|
||
| Moderate ( orange/red; high in areas with water table near the surface) - Sand, loamy sand or sandy loam soils with little organic matter and a water table generally greater than 30 feet below the ground surface. | |
|
|
|
| Moderate (yellow/red; high in sandy areas) - Generally clayey, silty or loamy soils with a water table less than 30 feet below the surface | |
|
|
|
| High (red) - Sand, loamy sand or sandy loam soils with little organic matter and a water table less than 30 feet below the ground surface | |
|
||
| Primary characteristics - general basis
for solid-filled symbols in the vulnerability maps. |
||||
| Secondary characteristics - general
basis for some cross-hatched symbols in the vulnerability maps. |
||||
The odd-numbered figures consist of three sections providing summary statistics of the vulnerability assessment and monitoring data. At the top of these figures is a table giving the number of wells and samples analyzed for each PMP product, as well an indication of the frequency of detection, and locations of these detections in relation to the vulnerability criteria explained below. The second section is a pie chart showing the percentage of samples collected for that geographical area by well type. The third section is a bar chart showing those samples having a detect by concentration range as a percent of all samples for each analyte.
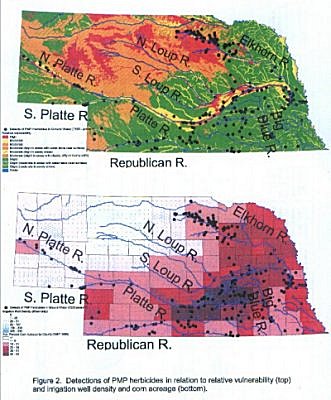
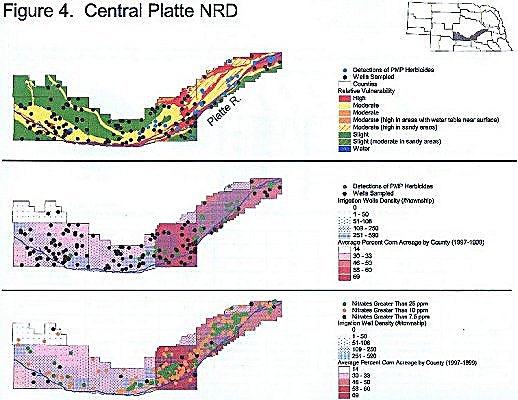
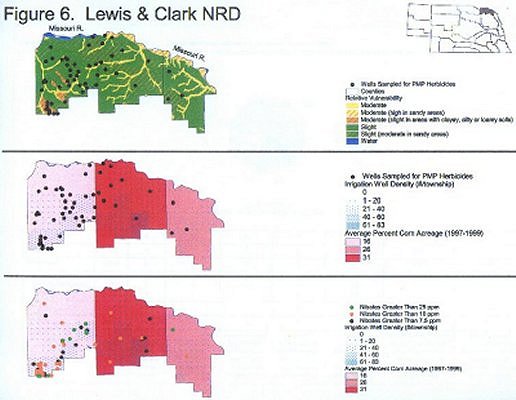
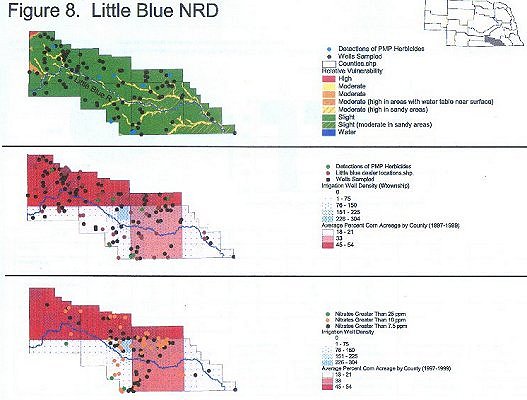
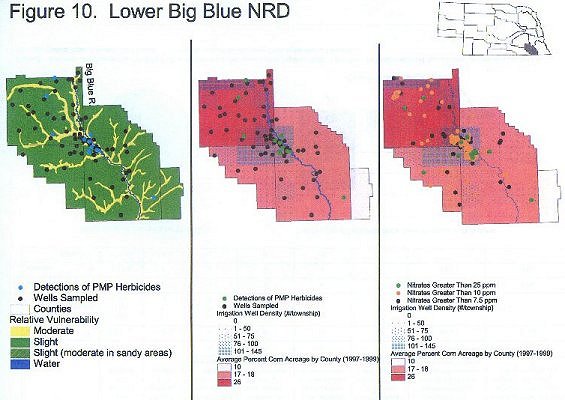
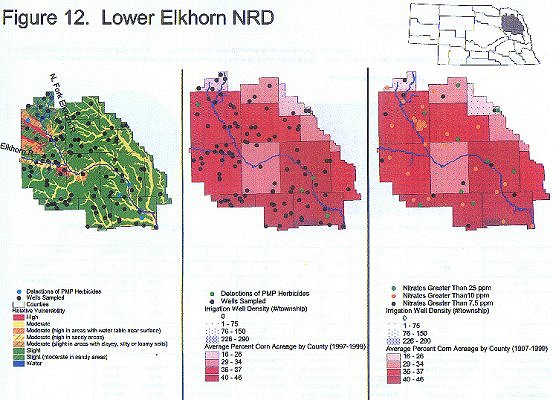
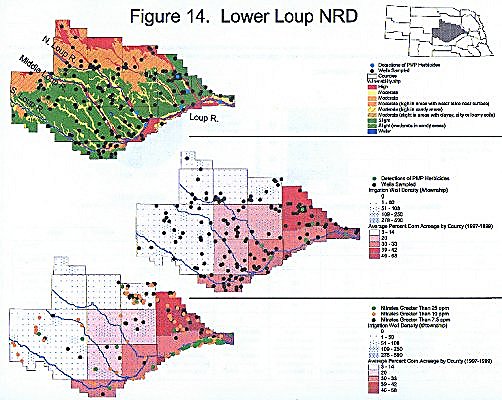
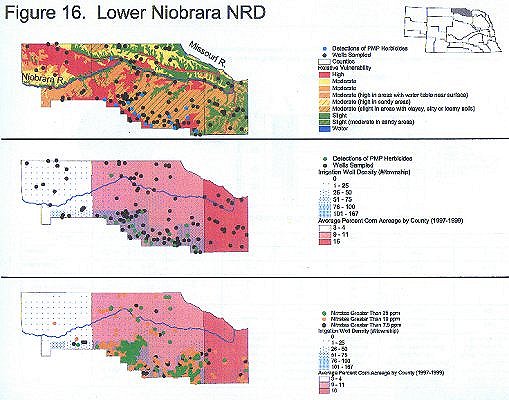
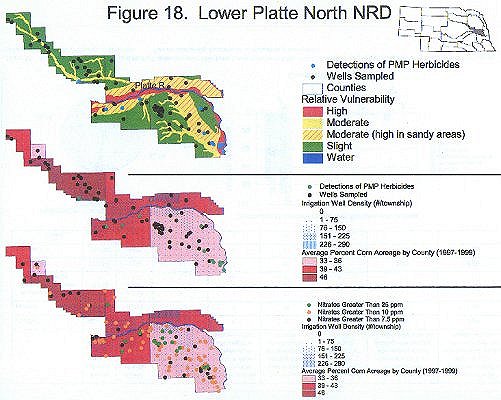
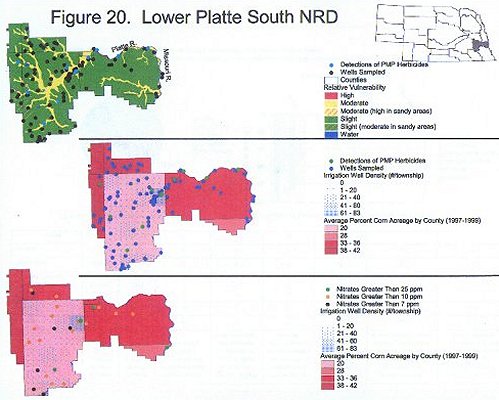
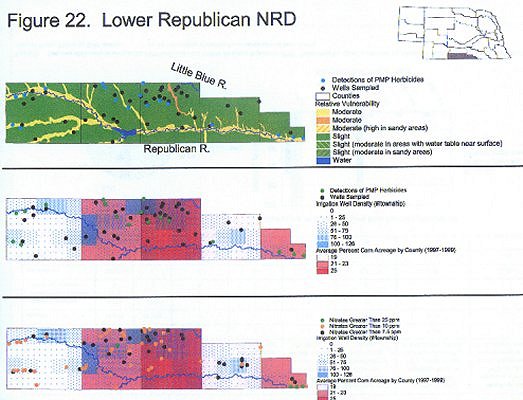
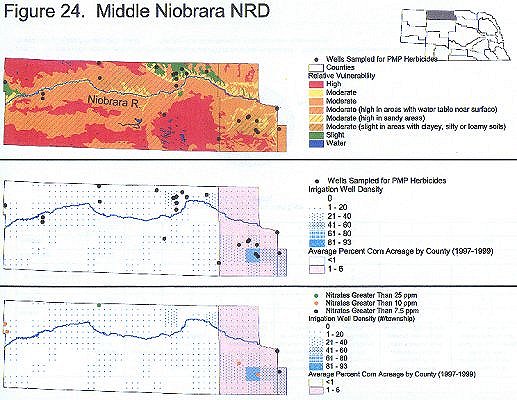
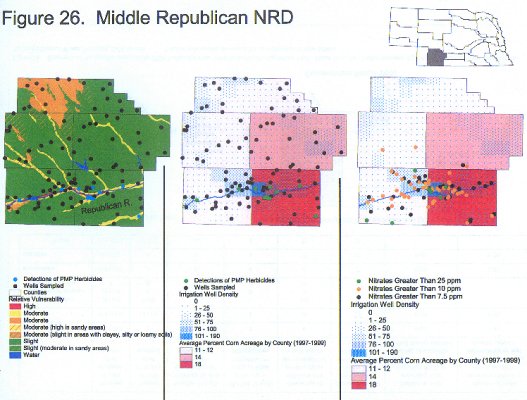
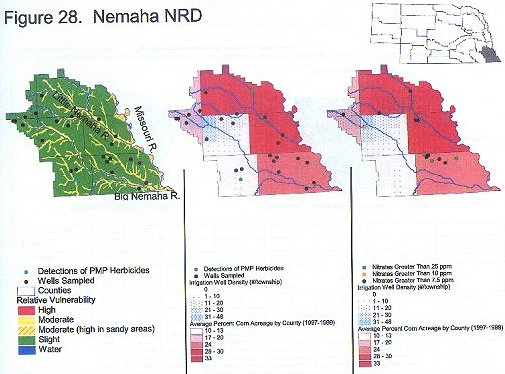
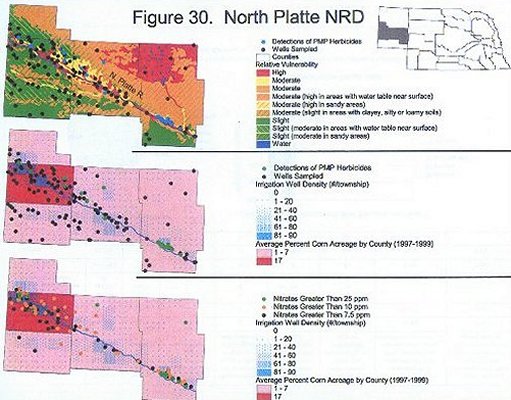
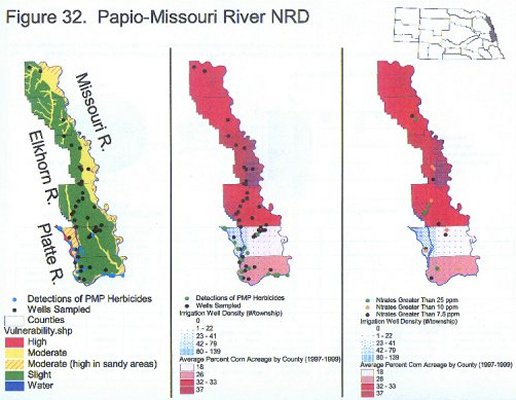
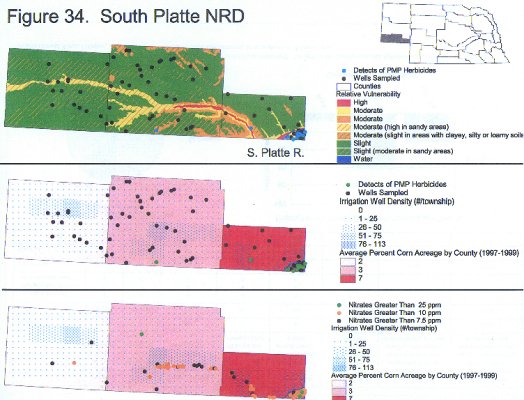
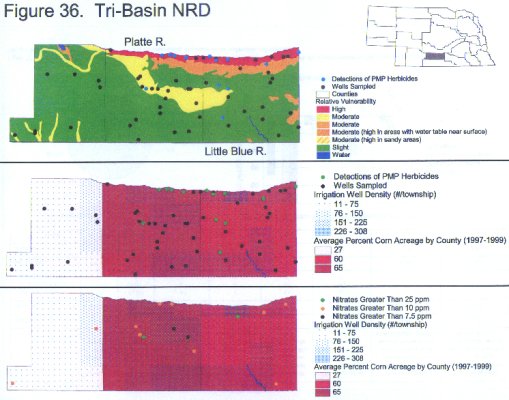
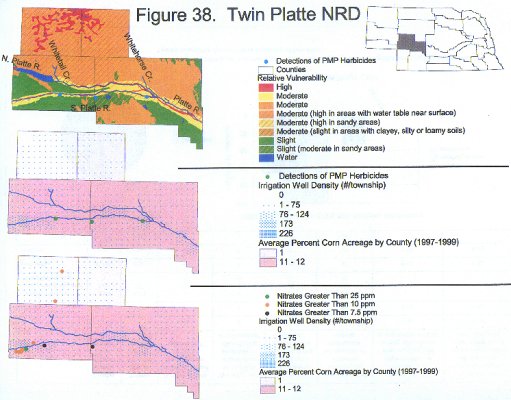
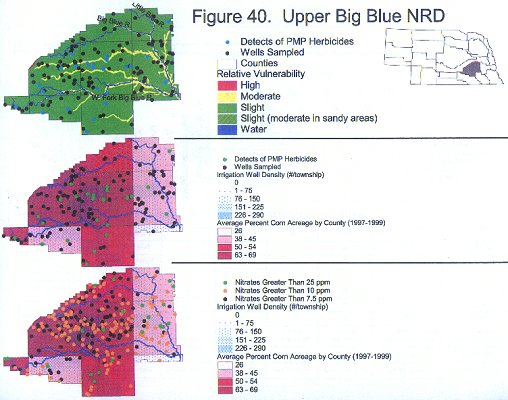
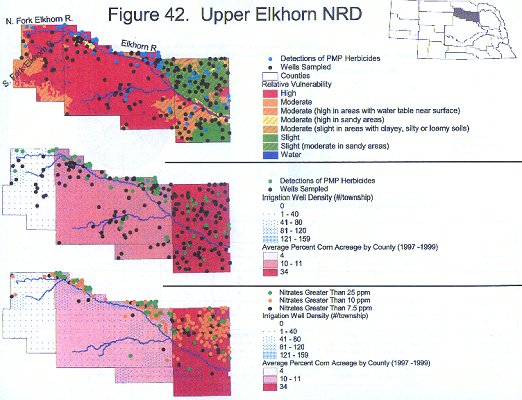
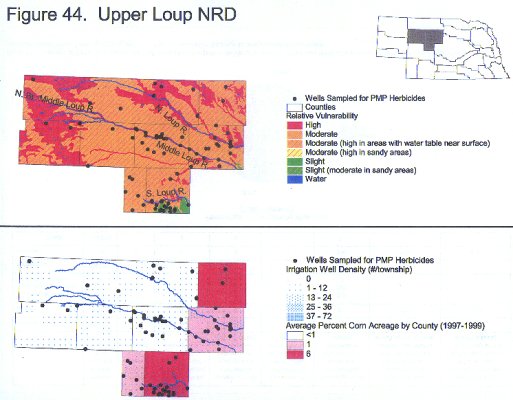
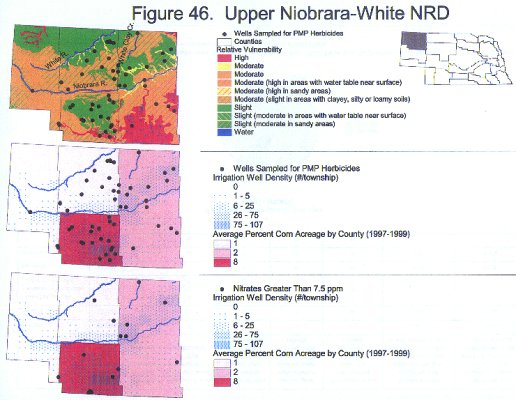
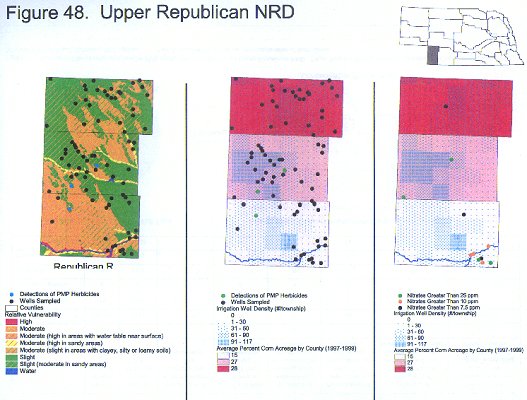
The even-numbered figures presented in this report are maps depicting the distribution of detections of PMP products and the spatial relationship between ground water contamination and the data layers described above. In addition to these data, nitrate detections are also given for comparison. Because pesticides in ground water are often found in areas also having nitrate contamination 8, 18 and because there are more nitrate analyses available than for any one pesticide, the presence of nitrates may help indicate potential for pesticide contamination where pesticide samples are lacking. These data also came from the February, 2001 update of the agrichemical database.
No differentiation was made as to whether detections of these agrichemicals are attributed to point or nonpoint sources. Point sources of contamination likely contribute more pollutant than legal usage of these agrichemicals and would likely contaminate ground water regardless of the conditions present at the site. Removing these instances, if at all possible, from this assessment would provide a more accurate picture of ground water vulnerability from actual use of these herbicides.
The moderate vulnerability classification includes areas having either sandier soil types or a shallow depth to ground water; the high classification meets both of these requirements. Just over half of Nebraska's land area is ranked moderately vulnerable or higher according to this system, however a large portion of this area is not farmed due to soils limitations, or is not planted to commodity crops receiving applications of these pesticides (the Sandhills region of the state and pasture/hay land, for example). The irrigation well density criteria of 108 per township (about 3 wells per square mile) was arbitrarily chosen, however, only approximately 10% of the state, or 25% of the cropped acreage, meet this criteria.
While the scale of the GIS coverages prevents one from saying with absolute certainty that any one well meets these conditions or that these conditions played a role in the presence of the contaminants, these results reinforce the premise that contamination in ground water is variable across the landscape and is dependant, at least partly, on these factors. Because of this, any regulatory or education program should target similar areas to prevent further contamination.
Another data layer that could be used in a vulnerability assessment is a measure of a pesticide's chemical properties and the relative potential for leaching to ground water. Because pesticides vary in the way they move through a system, this information would allow comparisons of the vulnerability between pesticides, given the same field conditions. An example of such a rating system is the Windows Pesticide Screening Tool, or WIN-PST, used by the USDA Natural Resources Conservation Service.19 Table 2 lists the four herbicides that would be targeted in a PMP, other common herbicides for comparison, and their chemical properties used to determine pollution potential with WIN-PST (solubility, persistence, and adsorption). WIN-PST also provides an 'interaction rating' (not shown) that is given when the pesticide properties rating is combined with a soils rating. This would be similar to combining the leaching potential rating with the vulnerability ratings presented in this report. An interaction rating, combined with the other information presented here, could be used to determine the potential of new pesticide products to contaminate ground water.
Additional information that could be incorporated to fine tune a vulnerability assessment at a more localized scale include land use data, similar to that being digitized by the NDNR.20 Data for much of the agricultural regions have been compiled and show classifications of land use, such as pasture, cropland, urban areas, etc, and whether the parcel is irrigated or not. The inclusion of the type of irrigation would also be helpful in an assessment because ground water under surface or flood- irrigation systems would typically be more vulnerable than that under a sprinkler-irrigated system due to the amount of water applied and the management needed. These information sources would need to be considered when developing programs at the regional level, if it is deemed beneficial.
Table 2. Comparison of application rates, chemical properties, and chronic toxicity of commonly-used corn herbicides.§
| Common Name | Maximum Application Rate on Corn ¶ (oz dry active ingredient [a.i.]/acre/year) | Estimated Use Rate on Neb. Corn
(2000; oz a.i./acre/yr) 21 |
% of Neb. Corn Acres Receiving
Application (2000; 8.5 million total) 21 |
Solubility (mg/L or ppm) | Half-Life (days) | KOC (ml/g) |
Leaching Potential° | Solution Runoff Potential | Adsorbed Runoff Potential | Human Toxicity (ppb) 22 |
| acetochlor | 48 | 25 | 17 | 223 | 14 | 150 | Intermediate | Intermediate | Low | 21 CHCL× |
| alachlor | 62 | 27 | 5 | 240 | 15 | 170 | Intermediate | Intermediate | Low | 2 MCL |
| atrazine | 40 | 18 | 80 | 33 | 60 | 100 | High | High | Intermediate | 3 MCL |
| desethyl atrazine | - | - | - | 320023 | ? | ? | - | - | - | - |
| desisopropyl atraz. | - | - | - | 67023 | ? | ? | - | - | - | - |
| bromoxynil | 8 | 4* | 1* | 0.08 | 7 | 10000 | Low | Low | Intermediate | 140 HA× |
| cyanazine * * | 16 | 17 | 2 | 170 | 14 | 190 | Intermediate | Intermediate | Low | 1 HA |
| dicamba | 12 | 3 | 16 | 400000 | 14 | 2 | High | Intermediate | Low | 200 HA × |
| dimethenamid | 24 | 16 | 5 | 1174 | 20 | 160 | Intermediate | Intermediate | Low | 35 HA × |
| glyphosate | 60 | 11 | 3 | 12000 | 47 | 24000 | Very Low | High | High | 700 MCL |
| isoxaflutole | 2.25 | 0.96 | 3 | 3.5 (6.2)24 | 3 | 147(134)24 | Low | Intermediate | Low | 3.1 DWLOC 4 |
| 202248* * * | - | - | - | 32624 | 6125 | 1724 | High | High | High | - |
| 203328* * * | - | - | - | ? | 97725 | ? | - | - | - | - |
| metolachlor | 96 | 18 | 45 | 530 | 90 | 200 | High | High | Intermediate | 100 HA |
| nicosulfuron | 0.99 | 0.48 | 12 | 2200 | 21 | 30 | High | Intermediate | Low | 8750 HA × |
| rimsulfuron | 0.5 | 0.2 | 10 | 7300 | 10 | 47 | Intermediate | Intermediate | Low | 112 HA × |
| simazine | 64 | - | - | 6.2 | 60 | 130 | High | High | Intermediate | 4 MCL |
§ - Chemical properties and rankings are from USDA NRCS' Pesticide Screening Tool, except as noted. Application rates are from product labels registered with the Nebraska Department of Agriculture.
¶ - Rate is often dependent on a combination of soil types, the formulation of product, the number and method of applications, and whether the product is used by itself or in combination with other herbicides.
- Soil organic carbon sorption coefficient; measures the affinity of pesticides to sorb to organic carbon. The higher the value, the greater the tendency to attach to and move with soil.
° - Pesticide Leaching Potential (PLP) = If log_val >= 2.8 then PLP = High; otherwise if log-val < 0.0 or SOL < 1 or HL <= 1 then PLP = Very Low; otherwise if log_val <= 1.8 then PLP = Low; otherwise PLP = Intermediate. (where log_val = (log (HL) * (4 - log (KOC)); HL = Half-Life; KOC = sorption coefficient;, and SOL =solubility. See the glossary in WIN- PST for the algorithms used to calculate the solution runoff and adsorption runoff potential.
- MCL = Maximum Contaminant Level; the maximum permissible level of a contaminant in
water delivered to users of a public water system. An enforceable standard;
DWLOC = Drinking Water Level of Comparison; the theoretical upper limit of "acceptable"
exposure after considering food and residential exposures as sources. Not a regulatory standard
for drinking water;
HA = Health Advisory level; an estimate of acceptable drinking water levels for a
chemical substance based on health effects information. Not a legally enforceable Federal
standard, but serves as technical guidance to assist Federal, state, and local officials.
HA× = Health Advisory level calculated by WIN-PST using the EPA method
for calculating health advisories. See the glossary in WIN-PST for additional references.
CHCL ×= Chronic Human Carcinogen Level; calculated by WIN-PST, is
comparable to an MCL level. See the glossary in WIN-PST for additional references.
* - 1999 estimates; none given for 2000.
* * - Product was included in the proposed PMP rule but its registration is in the process of being canceled and its remaining inventory will be depleted.
* * *- These are degradates of isoxaflutole.
Most of the detections across the state (65%) and in individual NRDs were below 0.5 ppb, however (bar charts in Figure 1 and subsequent odd-numbered figures). Table 2 provides the federal health standards (or targets for these standards) for comparison. These standards would be used to develop "triggers" for determining areas needing additional educational and/or regulatory programs as part of a PMP for the state. Only 34 wells, or slightly under 2 percent of the total sampled for atrazine, had concentrations above the Maximum Contaminant Level (MCL) of 3 ppb (Figure 1). No other contaminant exceeded its health standard; only simazine and alachlor exceeded one half of their standard (1 and 2 wells, respectively).
A large percentage (67%) of the wells used for sampling in this database are domestic wells. While samples from domestic wells provide some information about the ground water resource, many were constructed prior to the establishment of current construction standards, which decrease the potential of contamination via the well (direct or preferential flow to the water source).26 In addition, many domestic wells are located in the center of homesteads, where the mixing and loading of agrichemicals make them susceptible to contamination. By having more data from better constructed and located wells with known screened intervals, we can better determine whether the cause is due to nonpoint sources and make better decisions concerning labeled uses of these pesticides. The percentage of samples being collected from other well types is increasing as more data are submitted (pie charts in odd-numbered figures), but this is largely reflective of multiple samples from the few monitoring wells contributing data to the clearinghouse (198 monitoring wells having over 6,400 samples).
Data submitted to the Agrichemical Database must meet minimum standards for inclusion and are assessed a quality ranking based on well information, sample collection procedures, and analytical methods (Table 3). In this way, users can choose data serving their specific purpose. For this report, all samples analyzed for PMP products since 1990 were selected. The samples are fairly evenly split between quality flags 2 - 5 (Table 4). Approximately 60% of the samples from this dataset (1990-present) are in categories 3 and 4, as compared to only 40% when using all data for these products in the clearinghouse (1976-present). This indicates the quality of the data being collected is improving. Even so, the Water Quality Monitoring Advisory Committee, established to address questions posed by the Nebraska Legislature, recommended the formation of a ground water monitoring advisory committee to guide data-collecting organizations in well selection and placement, as well as recommend procedures for obtaining and analyzing the samples.27 A result of these activities, if implemented, will be a monitoring network which will provide better quality data with which to make decisions.
The Nebraska Department of Environment and Energy (NDEE) recently reported to the Nebraska Legislature on the status of water quality monitoring in the state. Table 5 summarizes the annual ground water sample estimates from detailed monitoring surveys submitted by organizations having ongoing projects or programs.28 Based on these data, roughly 5% of the ground water samples collected annually are analyzed for pesticides. This is not surprising considering the cost of analyzing samples for pesticides. This can be $150 to $300 per sample depending on the number of analytes, compared to nitrate analyses costing $10-15 each. The NDEQ report goes on to estimate the dollars needed to establish a fixed-site ground water monitoring network, which includes $700,000 for the installation of 200 monitoring wells and $300,000 in annual implementation. This would add to existing wells that could be used for this network, making a total of approximately 1000 wells statewide. An additional $1,550,000 annually is estimated by the organizations to make the needed improvements in meeting the goals and objectives of their respective programs (this total was extrapolated to include those entities not returning surveys). A significant percentage of this amount would be needed to have a comprehensive monitoring system for pesticides and would be an additional expense on top of this estimate.
The monitoring data, when viewed at a regional level, may not be enough to characterize the impacts of pesticides at a level required in a management plan, however. Ideally, any restriction placed on these products would apply only in the geographical areas having conditions determined to be the most vulnerable, without unduly burdening producers in areas where the risk is low (or where BMPs could reduce the risk). The state will need to balance the level of restrictions with the amount of enforcement available, and determine the level of monitoring to back up these measures.
The frequency and the depth of the samples will also need to be considered in a regional monitoring plan. The frequency should be such that contamination is detected and addressed in a timely manner. The majority of the compounds included in this report were sampled approximately 1.5 times per well over this period of time. For example, out of the 2,279 wells sampled for atrazine during this time period, 2,016 of them were sampled only once. Because ground water sources are three dimensional, it is necessary to evaluate the depth the samples are being taken to ensure that a problem is detected. For example, if only deep public or irrigation wells are used, the shallow to middle part of an aquifer may be contaminated for some time before being detected. These wells also tend to draw large amounts of water from different horizontal regions of an aquifer, potentially diluting the overall concentrations of contaminants. For the samples used in this report, 39% came from wells without screened interval information and 43% came from wells where the top of the screen was 30 to100 feet below the ground surface. The spatial and vertical distribution, as well as the frequency of samples will need to be evaluated at a regional level to determine what is best.
Additionally, the state will need to consider the presence of degradates in ground water. These are formed when the parent compound breaks down, and there are indications they may be, in some cases, as toxic as the parent. The effects of being exposed to multiple products is also unknown. While very few wells across the state had concentrations exceeding a product's MCL, over one third of the wells having a detection of any product also contained detections of at least one more parent compound (not including degradates).
This report was developed using statewide monitoring data available from the Agrichemical Database. There are likely monitoring projects not represented here that would add to this assessment. Because of this, water quality monitoring entities are encouraged to contribute their data so that evaluations of water quality can be as complete as possible. This report does not attempt to assess the trends of ground water quality in specific areas. There are likely areas in the state where management practices, targeted at reducing other agrichemical contaminants, are positively affecting the amount of pesticides reaching ground water. Continued long-term monitoring should allow the state to determine if this is the case, and will need to be carefully designed as a component of any management plan for pesticides in ground water. This same monitoring should also provide some degree of confidence that any regulations or restrictions applied are benefitting the resource and are only directed to the areas they are needed.
Table 3. Criteria for assessing pesticide sample data submitted to the Nebraska Agrichemical
Database for Ground Water.
| Pesticide Data | |||||
| LEVEL 1 | LEVEL 2 | LEVEL 3 | LEVEL 4 | LEVEL 5 | |
| Well location | 1/4 section at minimum | 1/4 section at minimum | 1/4 section at minimum | 1/4 section at minimum | 1/4 section at minimum |
| Well characteristics | use, depth | use, depth | use, depth | use, depth, screened interval | monitoring well, depth, screened interval |
| Sampling procedure & sample preservation | meets standard well purging guidelines and collection, handling, and preservation procedures given in method | meets standard well purging guidelines and collection, handling, and preservation procedures given in method | meets standard well purging guidelines and collection, handling, and preservation procedures given in method | meets standard well purging guidelines and collection, handling, and preservation procedures given in method | meets standard well purging guidelines and collection, handling, and preservation procedures given in method |
| Analytical method | not an EPA-accepted qualitative and quantitative method | an EPA- accepted method | an EPA- accepted method | a GC/MS EPA-accepted method | best available method specific for analyte |
| Field QC | none | none | field duplicates (FD) | FD, equipment blanks | FD, equipment blanks |
| Laboratory QC | cross-checks using an EPA- accepted method; participation in performance evaluation studies | less than level 3 | laboratory duplicates and the minimum QC specified in method | laboratory duplicates and the minimum QC specified in method | laboratory duplicates and the minimum QC specified in method |
Table 4. Summary of selected herbicide samples (1990 - present) according to well type and water quality flag, sorted by NRD. Taken from the February, 2001 update to the Agrichemical Database.
Table 5. Annual ground water samples collected in Nebraska. These estimates were
provided in surveys returned to the Nebraska Department of Environmental Quality as part of
Phase II of LB1234.
Odd number links - Summary of the samples analyzed for PMP herbicides since 1990 in
Nebraska
Even number links - Detections of PMP herbicides in relation to relative vulnerability and irrigation well density and corn acreage
| State | Figure 1 | Figure 2 |
| Central Platte NRD | Figure 3 | Figure 4 |
| Lewis & Clark NRD | Figure 5 | Figure 6 |
| Little Blue NRD | Figure 7 | Figure 8 |
| Lower Big Blue NRD | Figure 9 | Figure 10 |
| Lower Elkhorn NRD | Figure 11 | Figure 12 |
| Lower Loup NRD | Figure 13 | Figure 14 |
| Lower Niobrara NRD | Figure 15 | Figure 16 |
| Lower Platte North NRD | Figure 17 | Figure 18 |
| Lower Platte South NRD | Figure 19 | Figure 20 |
| Lower Republican NRD | Figure 21 | Figure 22 |
| Middle Niobrara NRD | Figure 23 | Figure 24 |
| Middle Republican NRD | Figure 25 | Figure 26 |
| Nemaha NRD | Figure 27 | Figure 28 |
| North Platte NRD | Figure 29 | Figure 30 |
| Papio-Missouri River NRD | Figure 31 | Figure 32 |
| South Platte NRD | Figure 33 | Figure 34 |
| Tri-Basin NRD | Figure 35 | Figure 36 |
| Twin Platte NRD | Figure 37 | Figure 38 |
| Upper Big Blue NRD | Figure 39 | Figure 40 |
| Upper Elkhorn NRD | Figure 41 | Figure 42 |
| Upper Loup NRD | Figure 43 | Figure 44 |
| Upper Niobrara-White NRD | Figure 45 | Figure 46 |
| Upper Republican NRD | Figure 47 | Figure 48 |
2. U.S. Environmental Protection Agency. 1991. Pesticides and Ground-Water Strategy. Office of Pesticides and Toxic Substances. 21T-1022. 78 pp.
3. National Research Council. 1993. Ground Water Vulnerability Assessment: Predicting Relative Contamination Potential Under Conditions of Uncertainty. 224 pp. National Academy Press. Washington D.C. (http://www.nap.edu/books/0309047994/html/)(9 January, 2013)
4. U.S. Environmental Protection Agency. 1993. Guidance for Pesticides and Ground Water State Management Plans. EPA-735-B-93-005a.
5. Aller, L., Bennett, T., Lehr, J.H., and Petty, R. 1985. DRASTIC: A Standardized System for Evaluating Ground Water Pollution Potential Using Hydrogeologic Settings. EPA 600-285-018. 163 pp.
6. NAPRA: National Agricultural Pesticide Risk Analysis.
7. Groundwater Loading Effects of Agricultural Management Systems (GLEAMS).
8. Druliner, A.D., H.H. Chen, and T.S. McGrath. 1996. Relations of Nonpoint Source Nitrate and Atrazine Concentrations in the High Plains Aquifer to Selected Explanatory Variables in Six Nebraska Study Areas. (http://pubs.er.usgs.gov/publication/wri954202). (9 January, 2013)
9. Nebraska Department of Agriculture. 1997. Pesticides and Groundwater Generic State Management Plan. (http://www.agr.ne.gov/pesticide/gwater2.html) (9 January 2013)
10. Nebraska Unicameral. 2001. Nebraska Ground Water Management and Protection Act. Sections 46-656.01 to 46-656.67 (http://uniweb.legislature.ne.gov/) (9 January, 2013)
11. University of Nebraska Conservation & Survey Division. 2000. Pesticides and Groundwater: An Applicator's Map and Guide to Prevent Groundwater Contamination. (http://snr.unl.edu/data/publications/pestguides.asp) (9 January, 2013)
12. Merchant, J.W. 1994. GIS-Based Groundwater Pollution Hazard Assessment: A Critical Review of the Drastic Model. Photogrammatic Engineering and Remote Sensing. 60(9):1117-1127.
13. Kalinski, R.J., W.E. Kelly, I. Bogardi, R.L. Ehrman, and P.D. Yamamoto. 1994. Correlation Between DRASTIC Vulnerabilities and Incidents of VOC Contamination of Municipal Wells in Nebraska. Ground Water, 32(1):31-34.
14. USDA National Agricultural Statistics Service. 2001. 2000 Nebraska Agricultural Statistics. 1997-1999 Corn Acres Planted - All Purposes. pp 8-9.
15. U.S. Federal Register. 1996. Pesticides and Ground Water State Management Plan Regulation. Proposed Rule. Vol. 61, No. 124. June 26, 1996.
16. Nebraska Department of Natural Resources. Irrigation Well data. (http://dnr.ne.gov/) (9 January, 2013)
17. University of Nebraska Water Sciences Laboratory. 2000. Quality-assessed Agrichemical Contaminant Database for Nebraska Ground Water. A cooperative project of the Nebraska Departments of Agriculture, Environmental Quality, and Natural Resources and the University of Nebraska Water Sciences Laboratory. (https://clearinghouse.nebraska.gov) (8 May, 2017)
18. Exner, M.E. and R.F. Spalding. 1990. Occurrence of Pesticides and Nitrate in Nebraska's Ground Water. Institute of Agriculture and Natural Resources, University of Nebraska. 34 pp.
19. USDA Natural Resources Conservation Service, National Water and Climate Center. July 7, 2000. Windows Pesticide Screening Tool (WIN-PST). Version 2.0050. (http://go.usa.gov/KoK) (9 January, 2013)
20. Nebraska Department of Natural Resources. Land Use Data (http://www.dnr.ne.gov/data) (9 January, 2013)
21. USDA National Agricultural Statistics Service. 2001. 2000 Nebraska Agricultural Chemical Usage. (http://bit.ly/VgtkRL) (9 January, 2013)
22. U.S. Environmental Protection Agency. (Summer 2000). Drinking Water Regulations and Health Advisories. EPA-822-B-00-001. (http://1.usa.gov/GzMtJB) (9 January, 2013)
23. Syracuse Research Corporation. (August, 2001). Physical Properties Database, Interactive PhysProp Database Demo. (http://bit.ly/WtQXC8) (9 January, 2013)
24. U.S. Environmental Protection Agency. (September 1998). Pesticide Fact Sheet. (http://1.usa.gov/VHQ3DA) (9 January, 2013)
25. Taylor-Lovell, S., G. Sims, L. Wax, and J. Hassett. (2000). Hydrolysis and soil adsorption of the labile herbicide isoxaflutole. Environmental Science and Technology. 34:3186-3190.
26. University of Nebraska Cooperative Extension. 1998. Farm A Syst Fact Sheet #3: Improving Drinking Water Well Condition. EC98-765-S. 12pp.
27. Nebraska Department of Environmental Quality. 2001. Comprehensive Study of Water Quality Monitoring in Nebraska; LB1234 Phase II Report. (http://www.deq.state.ne.us/Publica.nsf/Pages/WAT020) (9 January, 2013)
28. Nebraska Department of Environmental Quality. 2000. Comprehensive Study of Water Quality Monitoring in Nebraska; LB1234 Phase I Report. (http://www.deq.state.ne.us/Priority.nsf/Pages/CSWQMN) (9 January, 2013)